Results measurement
Review all your campaign data in real time: conversions, traffic sources, user behavior and full funnel. Spot the strengths, detect the leaks, and maximize the results of every activity.
What you can measure
All the data you need to understand how your campaign performs, from the first minute.
Real-time data
Live stats from the very first minute your campaign goes live, with no delays or deferred loading.
Conversion funnel
Visualize your campaign's full funnel, from the initial visit to the completed form.
Traffic sources
Automatic detection of the channels and sources driving traffic to your campaign. Filter by totals or by source.
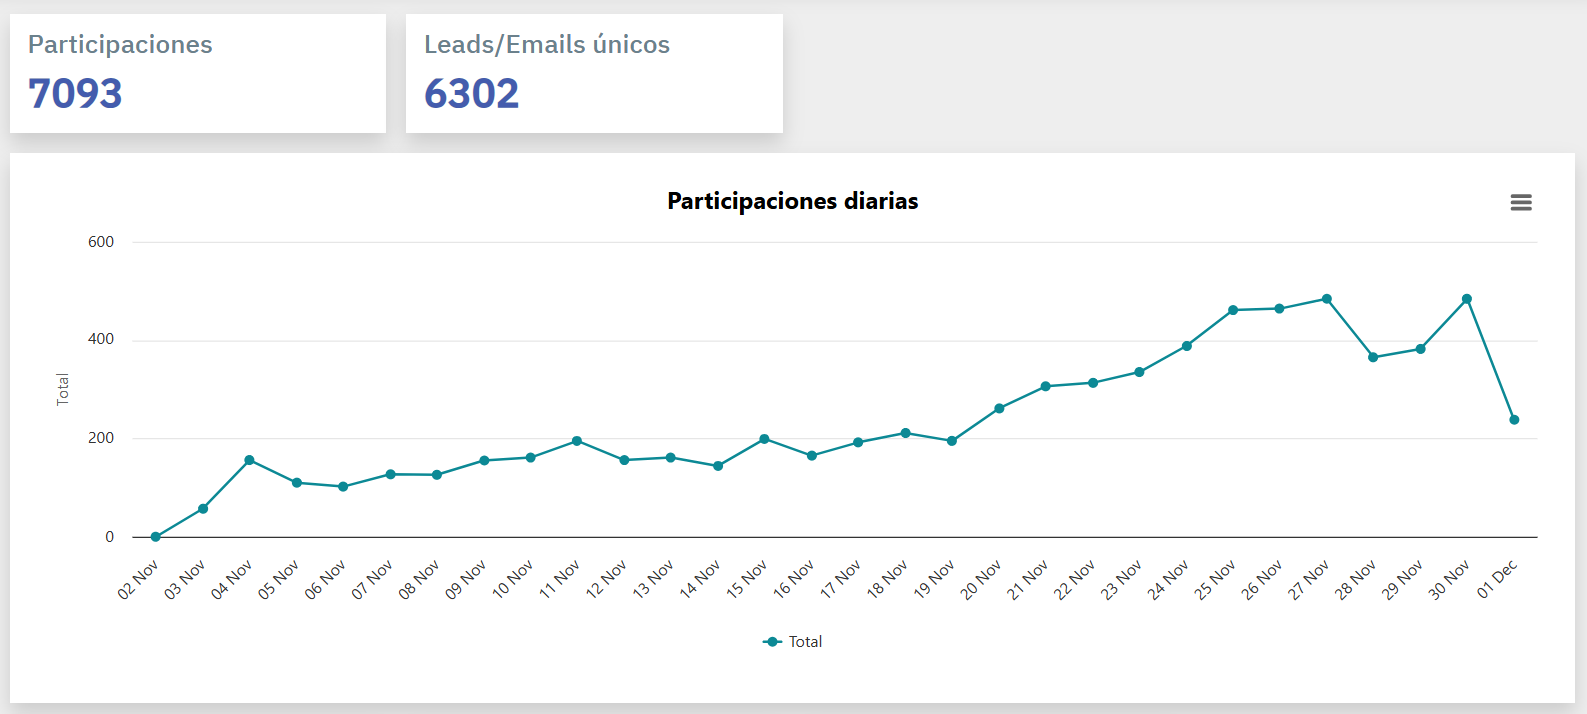
Participations
By hour, day, device or source. Spot the best moments to push your campaign and reach your audience.
Visits and page views
Full traffic data for every screen of the campaign, with user behavior analysis.
Leak detection
Identify the screens where users drop off. Reinforce what works and fix what doesn't.
By device
Data segmented by mobile, tablet and desktop to optimize the experience on every format.
Downloadable reports
Export all your campaign data to PDF and Excel to share with management or clients.
This is what you'll see
Two real views from the Cool Tabs measurement panel.
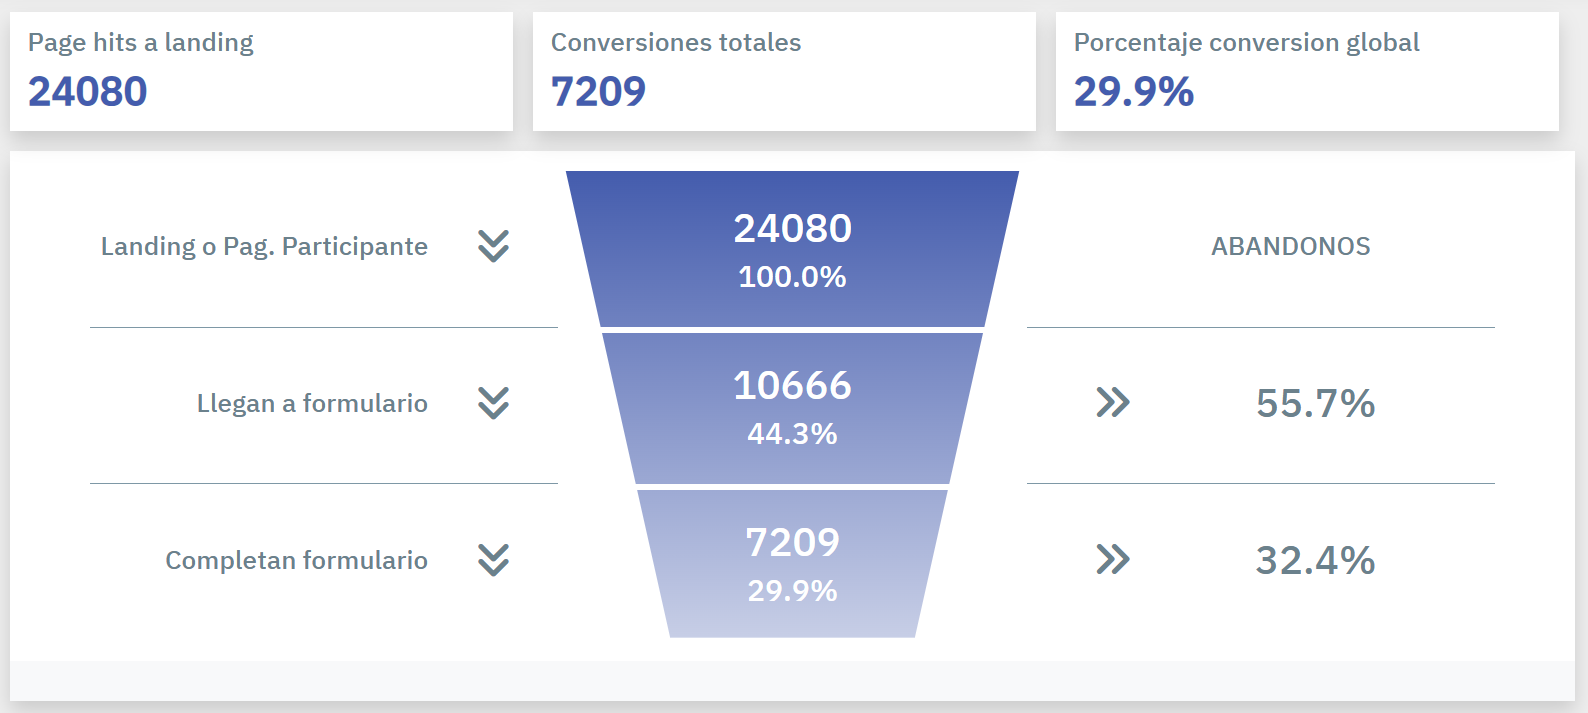
See your campaign's conversion funnel
Visualize your campaign's full funnel, from how many users landed to how many completed the form. Spotting where leaks happen is essential. Is the main image attractive enough? Is the quiz too long? Are you asking for too much data? Reinforce what works and fix what doesn't. All in real time.
Apply the results to your strategy
If a campaign works well, repeat what made it work. With full traffic, source and conversion data detected automatically, you can identify which channels, copies and creatives convert best. Make the right adjustments and multiply the success of your next activities.
Measure your campaign in 5 steps
From raw data to actionable decisions.
Launch your campaign
Publish your campaign with Cool Tabs and measurement activates automatically from minute one.
Open the panel
Check conversions, traffic sources, participations and the full funnel live.
Spot the leaks
Detect which screens lose users and understand why drop-offs happen.
Adjust in real time
Take corrective actions while the campaign is still live to maximize results.
Download reports
Export all data to PDF and Excel to share with management, team or clients.
In your panel or in your tech stack
You decide where you want to analyze the data from your campaigns.
All inside Cool Tabs
Access all your campaign data from the Cool Tabs panel, with ready-to-read visualizations that help you understand the results without spreadsheets or third-party tools.
- Live stats from minute one
- Full conversion funnel and leak detection
- Data by hour, day, device and source
- Full report downloads in PDF and Excel
Connect with your tools
Sync the data from your campaigns with the platforms you already use. Real-time data push, native integrations and a full API so data flows exactly where you need it.
- Google Analytics and Google Tag Manager
- Salesforce, HubSpot, Pipedrive, ActiveCampaign, Mailchimp
- Audience export
- REST API and webhooks for custom integrations
Start measuring your results
Visualize user behavior, spot strengths and leaks, and maximize the performance of every campaign you launch.